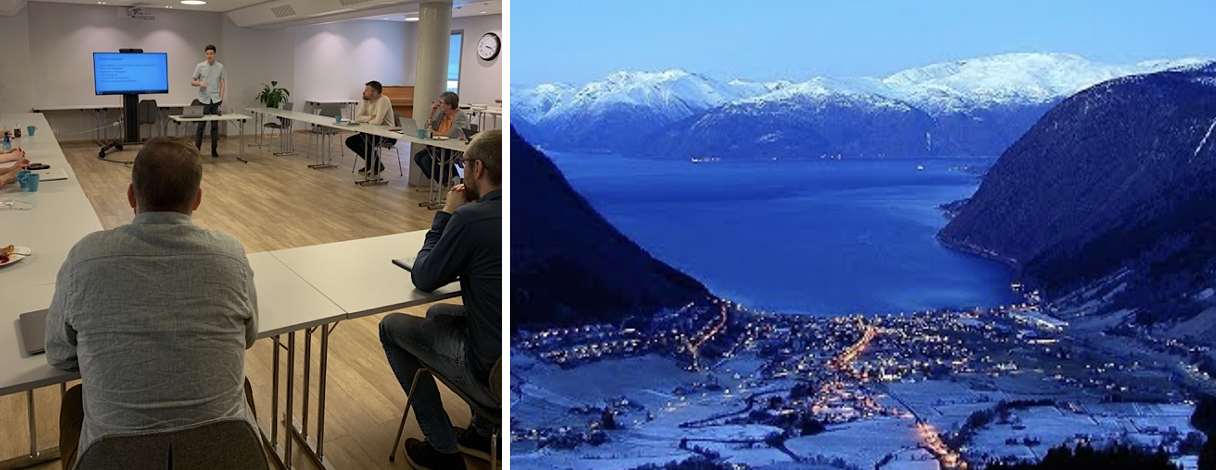
On August 17th, the MediaFutures team led by prof. Morten Field visited Highsoft´s headquarters in Vik/Sogn. The goal of the visit was to get to know each other, and to discuss cooperation opportunities in digital data visualization and accessibility.
With the wide use of large datasets and graphs, visual display of information has become an integral part of our lives. From color-coded maps of polls to charts communicating stocks, sports, and public health data, visualization and infographics are powerful tools when it comes to making sense of the fast-paced, convoluted processes.
While an increasing number of businesses and public entities employ graphics to communicate insights and solutions, user interface designers produce increasingly rich visualizations to meet demands. Such visualizations, however, are often being designed in a manner that does not consider individual users’ needs at all or does it in an insufficient way. A non-personalized design, where each individual user is being shown the same visualization in the same form, is particularly problematic for people with impairments.
According to the World Bank, one billion people – or 15% of the world’s population – experience a disability. Of those affected, 295 million are estimated to live with visual impairment. Difficulties in accessing visualizations, however, are not confined to sight-impaired only. They are also experienced by people with cognitive disabilities who struggle with abstract thinking or decoding symbolic conventions used in visualizations, and by those with motor disabilities caused by conditions such as e.g., the Parkinson’s disease. For the latter user group, operating interactive visualizations constitutes a challenging task.
Despite progress made in the field of information visualization, many kinds of plots and graphs remain inaccessible for people with perceptual and physical impairments. The lack of accessibility can have negative impact on their health, learning, and work situation. Ensuring that fewer disabled users are left behind is a top priority for visualization practitioners and researchers.
Committed to accessibility
As a world’s leading provider of charting tools for web, Highsoft has long been committed to ensure digital accessibility for people with impairments.

Figure 1. A few examples of Highsoft’s web charts. The company’s top priority is to offer charts that are accessible to all groups of users.
“As a company with a large user base, we recognize our social responsibility to aid in equal access to information. We aim to ensure a great user experience for all users of our products and services, and to help develop and advance the field of data visualization accessibility”, says Øystein Moseng, Highsoft’s Head of Accessibility.
The Norwegian company is now exploring potential cooperation opportunities with MediaFutures.
Mosengs eloborates: “We are excited to explore potential collaborations with MediaFutures, to learn from the fascinating academic work that is being done, and get to know this team of people who are highly dedicated to improving the way we interact with technology.”
Through the collaboration with HighSoft, the WP4 team expects to enrich and improve metadata visualization, e.g., in sports reporting, and to stimulate and improve design practices in serious gaming.
About Highsoft
Highsoft, founded in 2009, is the company behind the Highcharts Javascript charting library, and its siblings Highcharts Stock, Highcharts Maps and Highcharts Gantt. Highcharts is written in JavaScript, rendering charts in SVG, making it easy to add responsive, interactive charts to web and mobile applications. For over a decade, Highsoft has been the leading provider of charting tools for the web, and remains the preferred solution for developers and enterprises alike, with 80 of the world’s 100 largest companies as customers.

